1. Give visitors a clear place to start
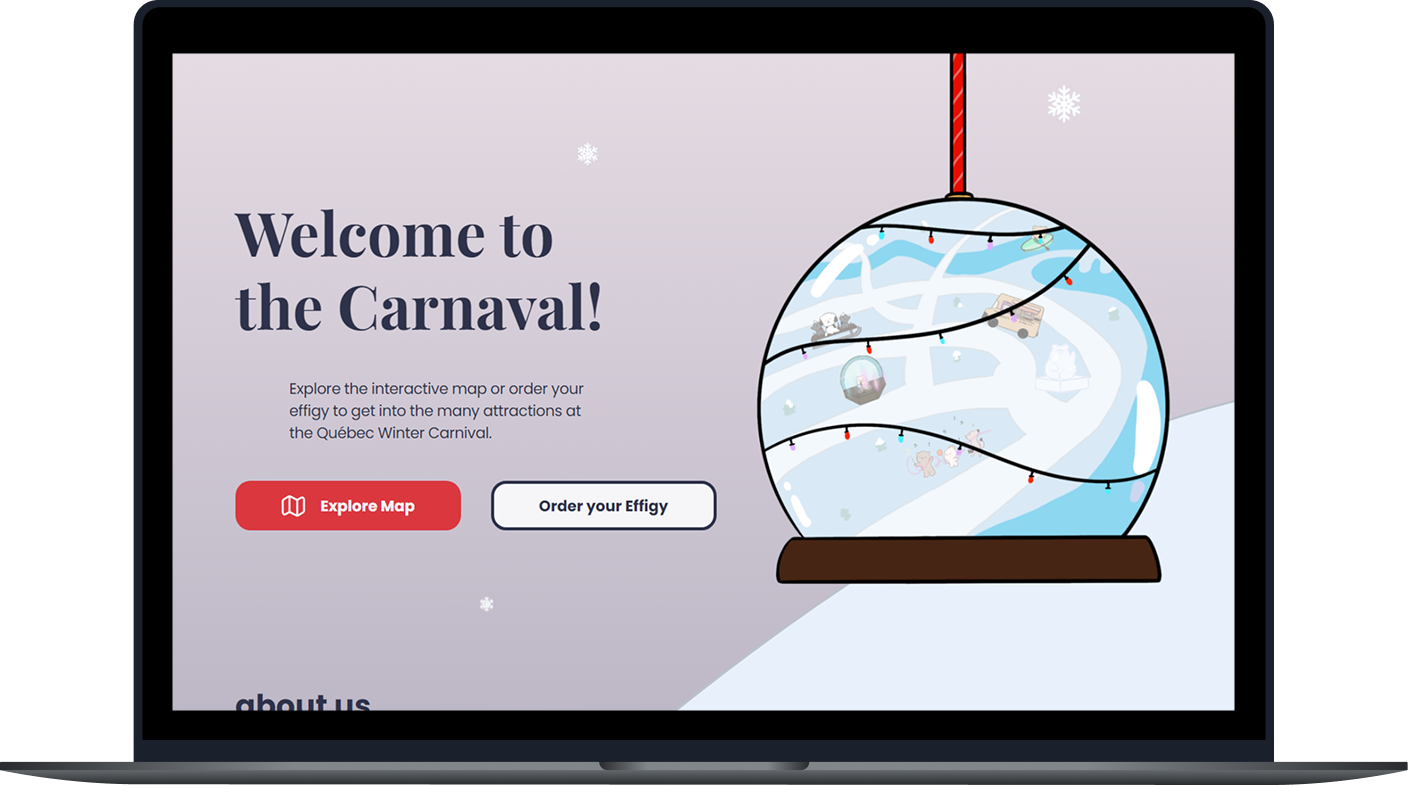
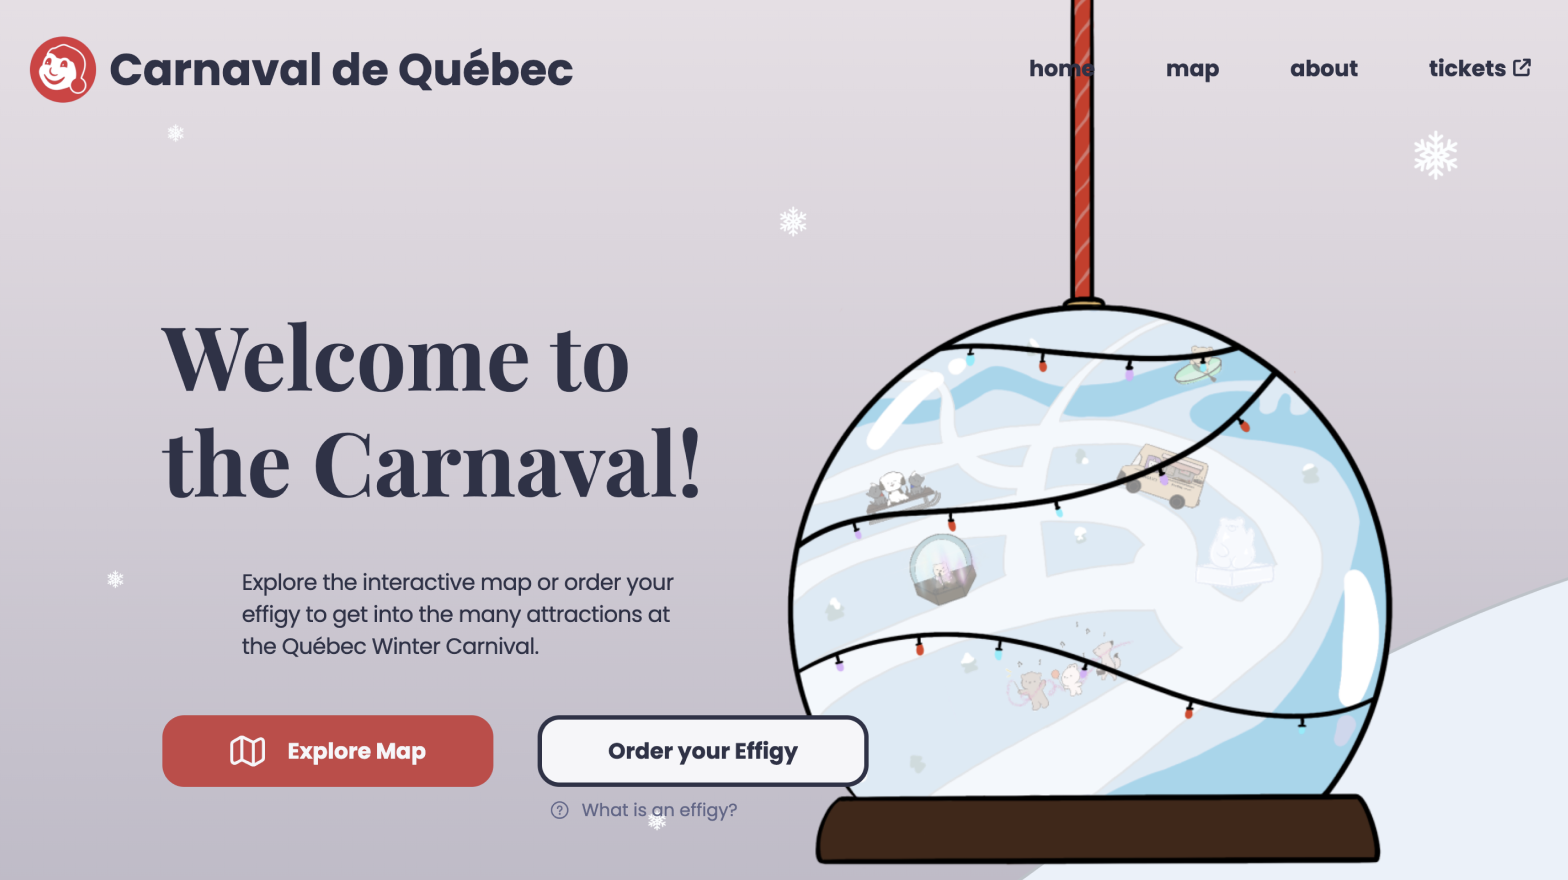
I added a preview of the carnival map inside the snow globe. Visitors can select Explore Map to see what activities they might want to try.
Helping visitors choose carnival activities through an interactive map
Our goal was to create a microsite that helps families explore the carnival’s winter activities and choose which ones to try.
I worked on a team of five from research through coding. I identified challenges in attracting tourists to the carnival. I used Figma to design the landing pages and the activity pop-ups. I then built the homepage, interactive map, and pop-ups into a functional microsite using HTML, CSS, and JavaScript.
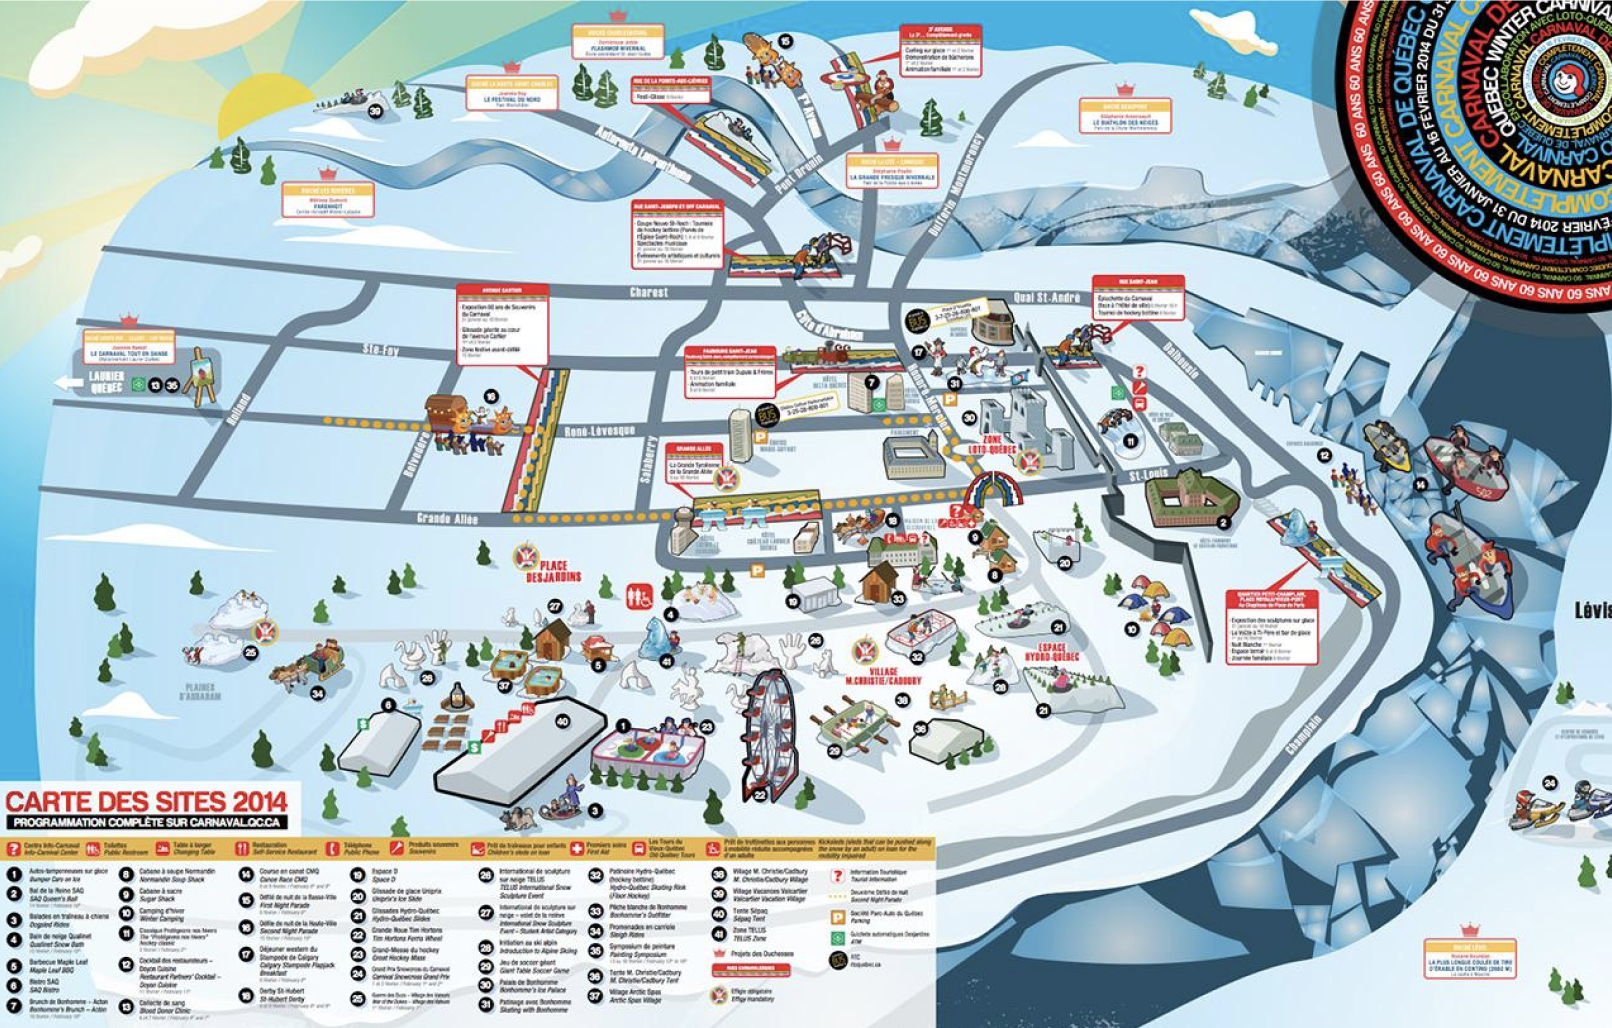
Jump to the prototypeThe carnival website didn’t show a list of its activities. However, we found over 20 activities when we looked at their official map, which could overwhelm families and make it hard to decide. We saw an opportunity to showcase the activities visitors enjoy the most through visual element and storytelling.
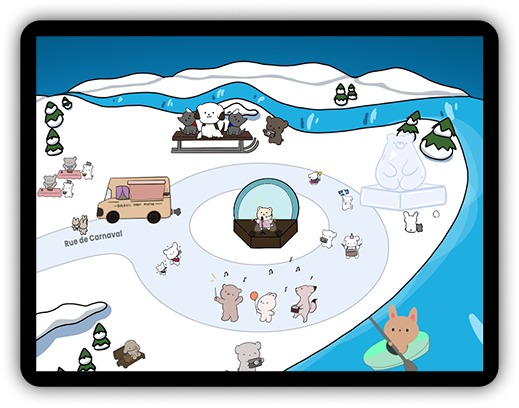
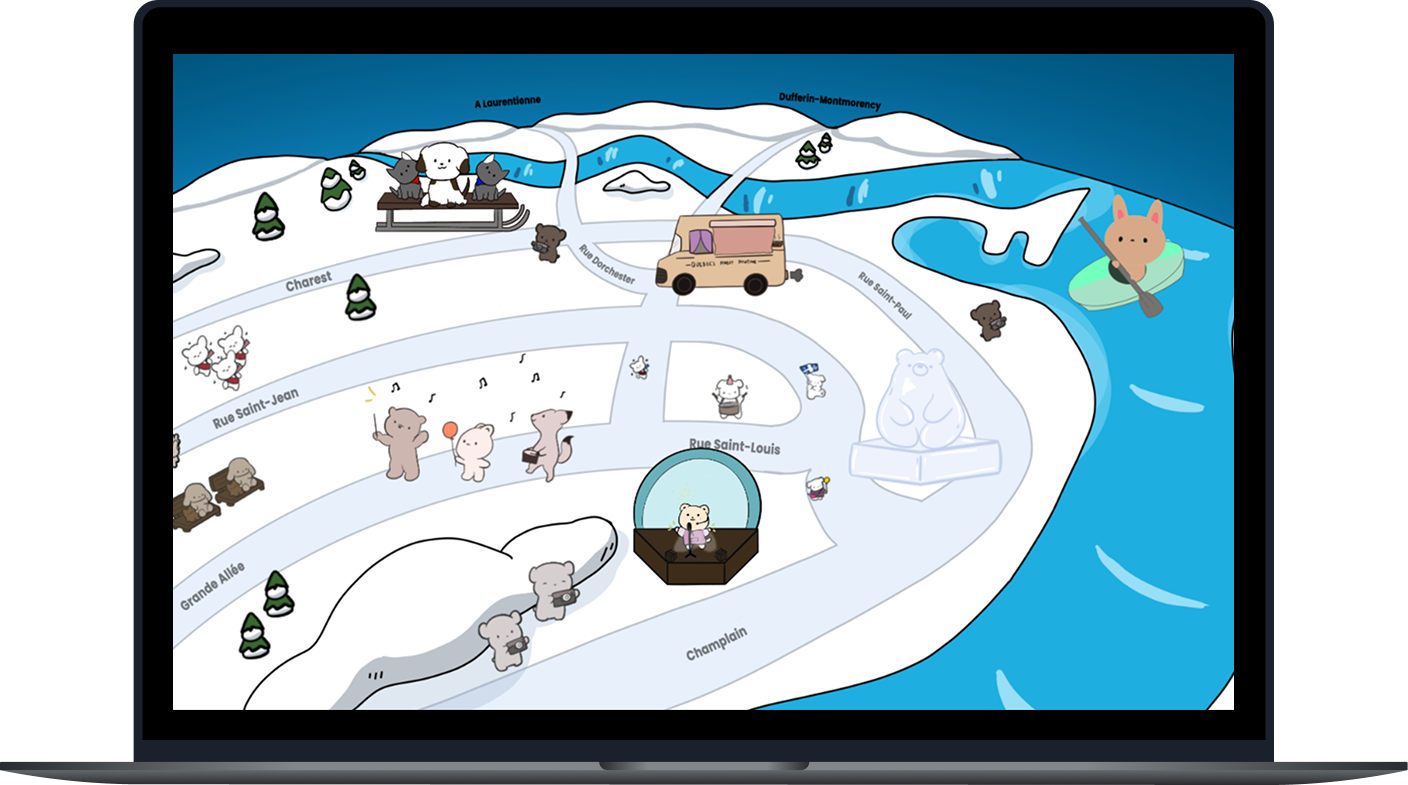
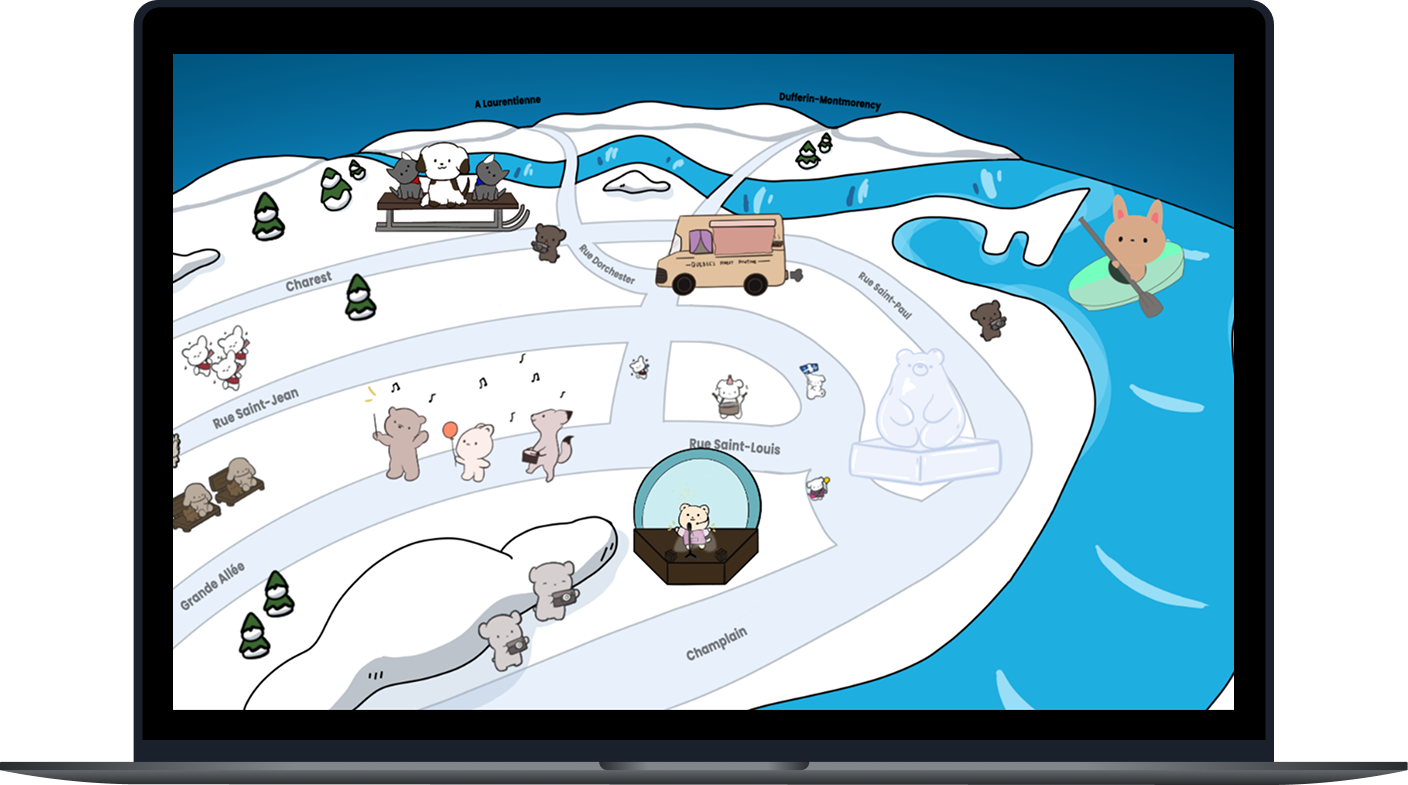
The map showcases the carnival’s main activities. Visitors can select each illustration to learn more about the activity before deciding which ones to try.
I added a preview of the carnival map inside the snow globe. Visitors can select Explore Map to see what activities they might want to try.
Each activity has its own illustration, such as a van for food truck. The icons bounce and change on hover to show they can be clicked.
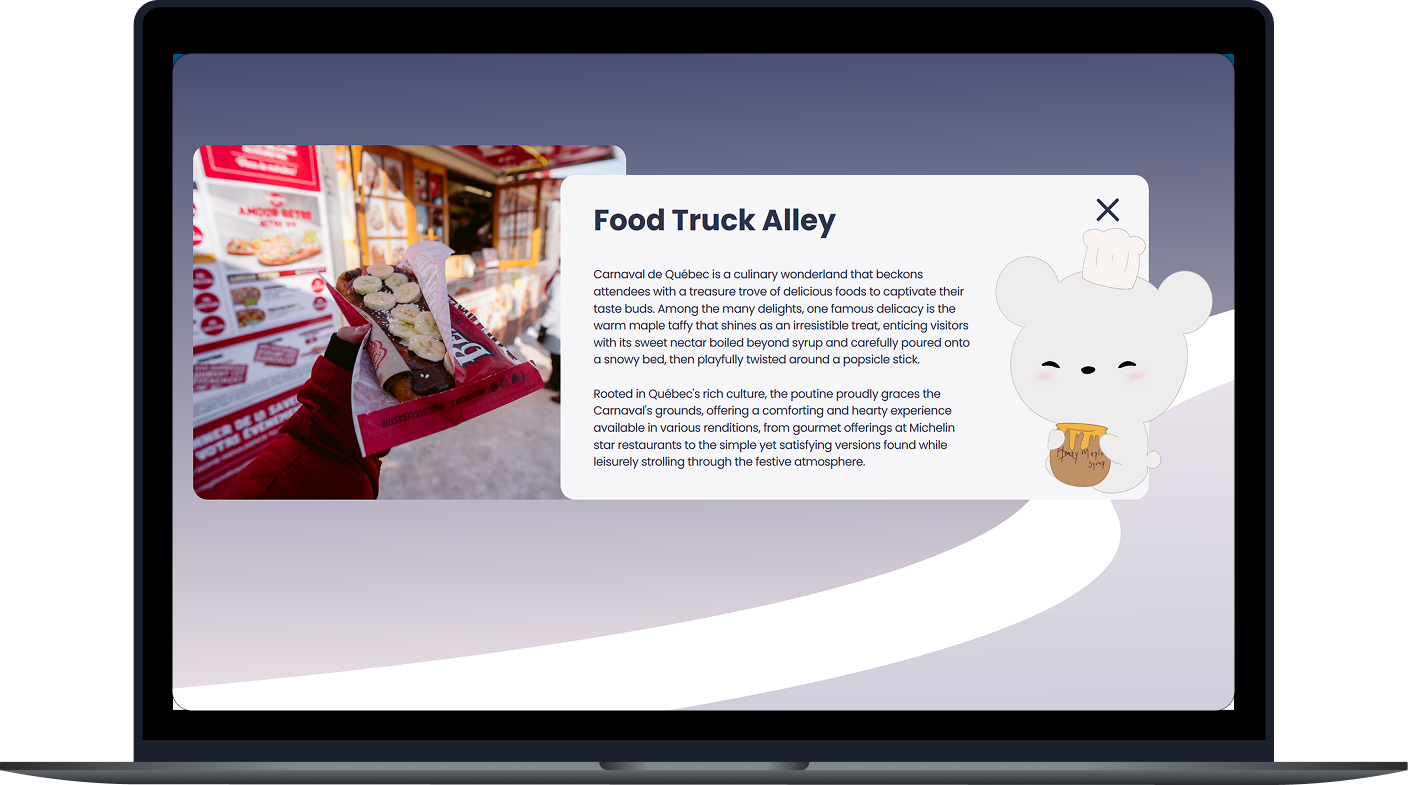
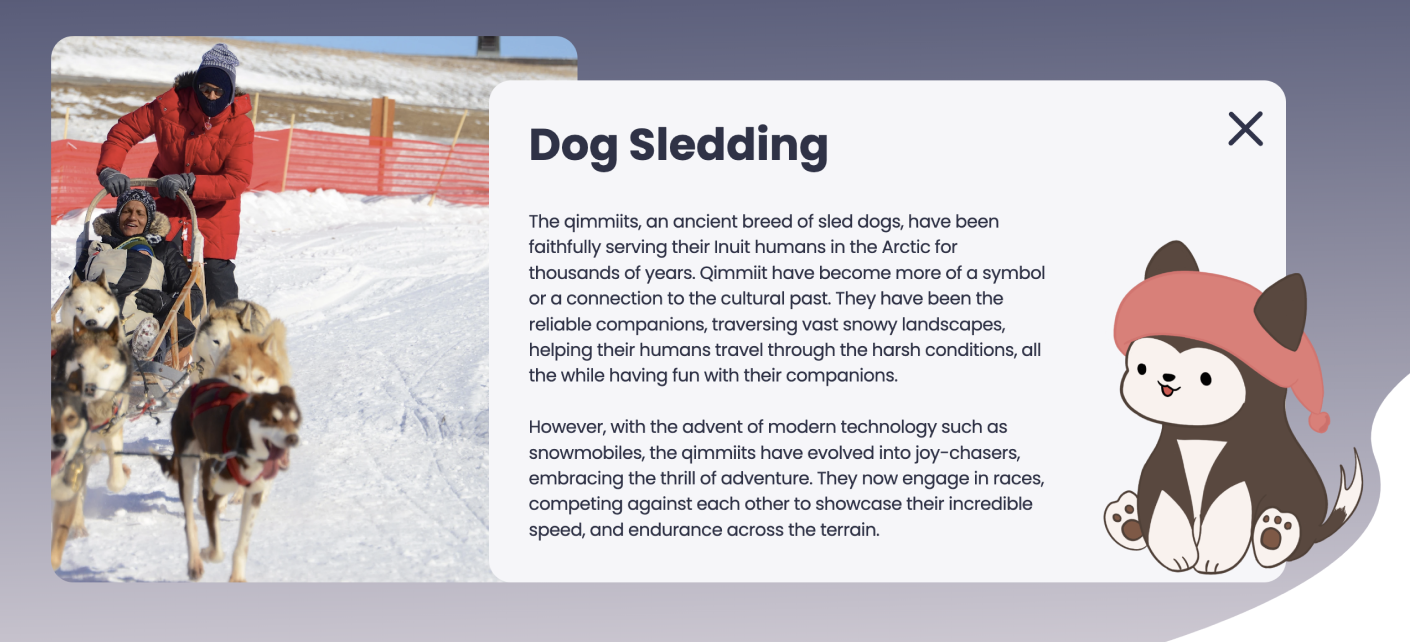
Selecting the food truck opens a photo and a short description of the activity. Visitors can close it and return to the map to explore another activity.
I read visitor reviews on Tripadvisor to learn how the activities affected their visit.
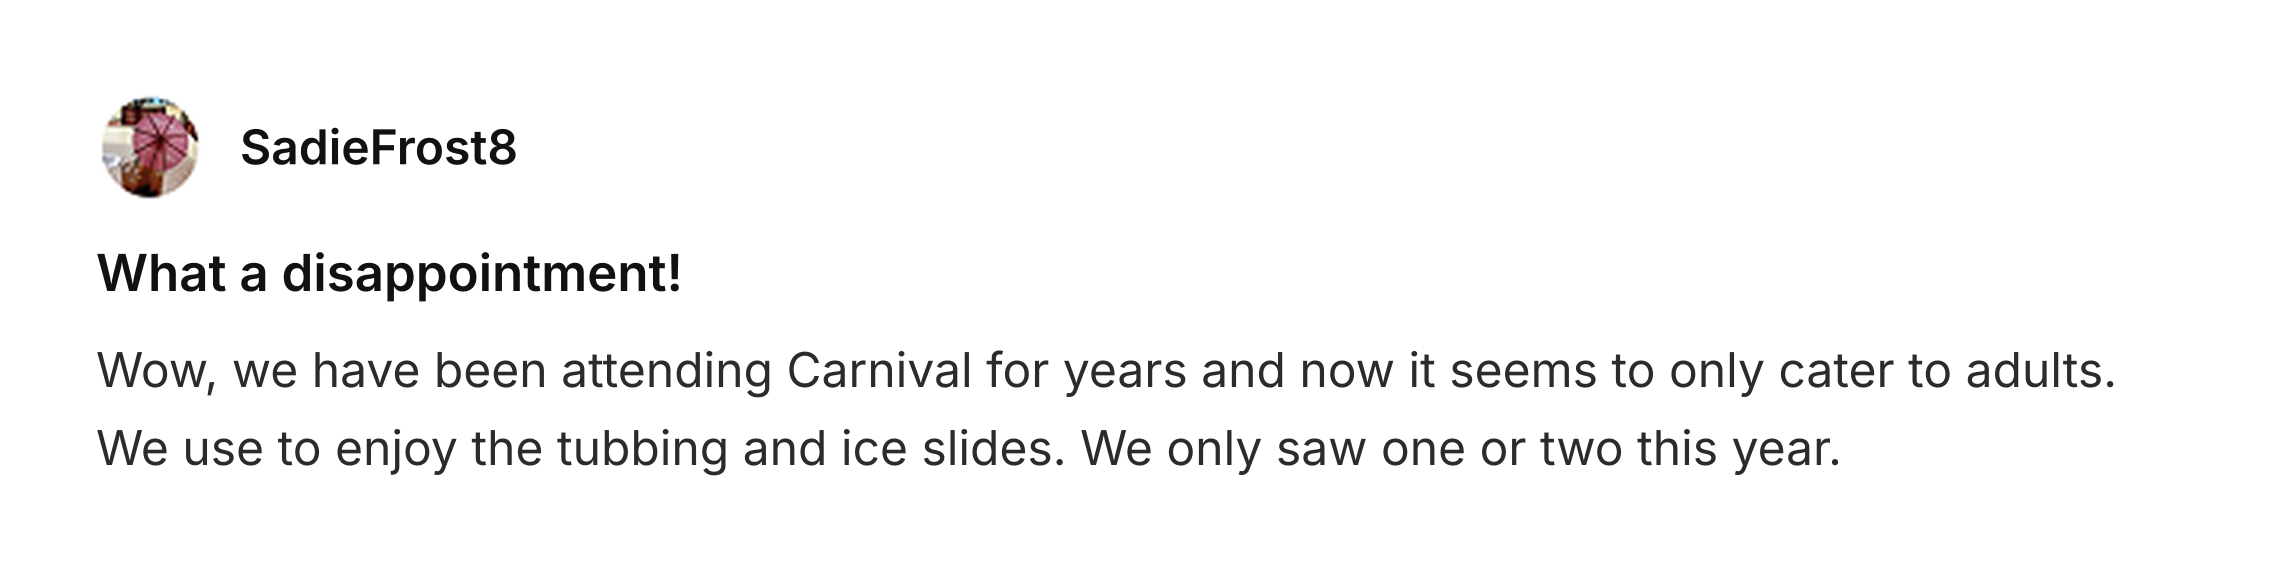
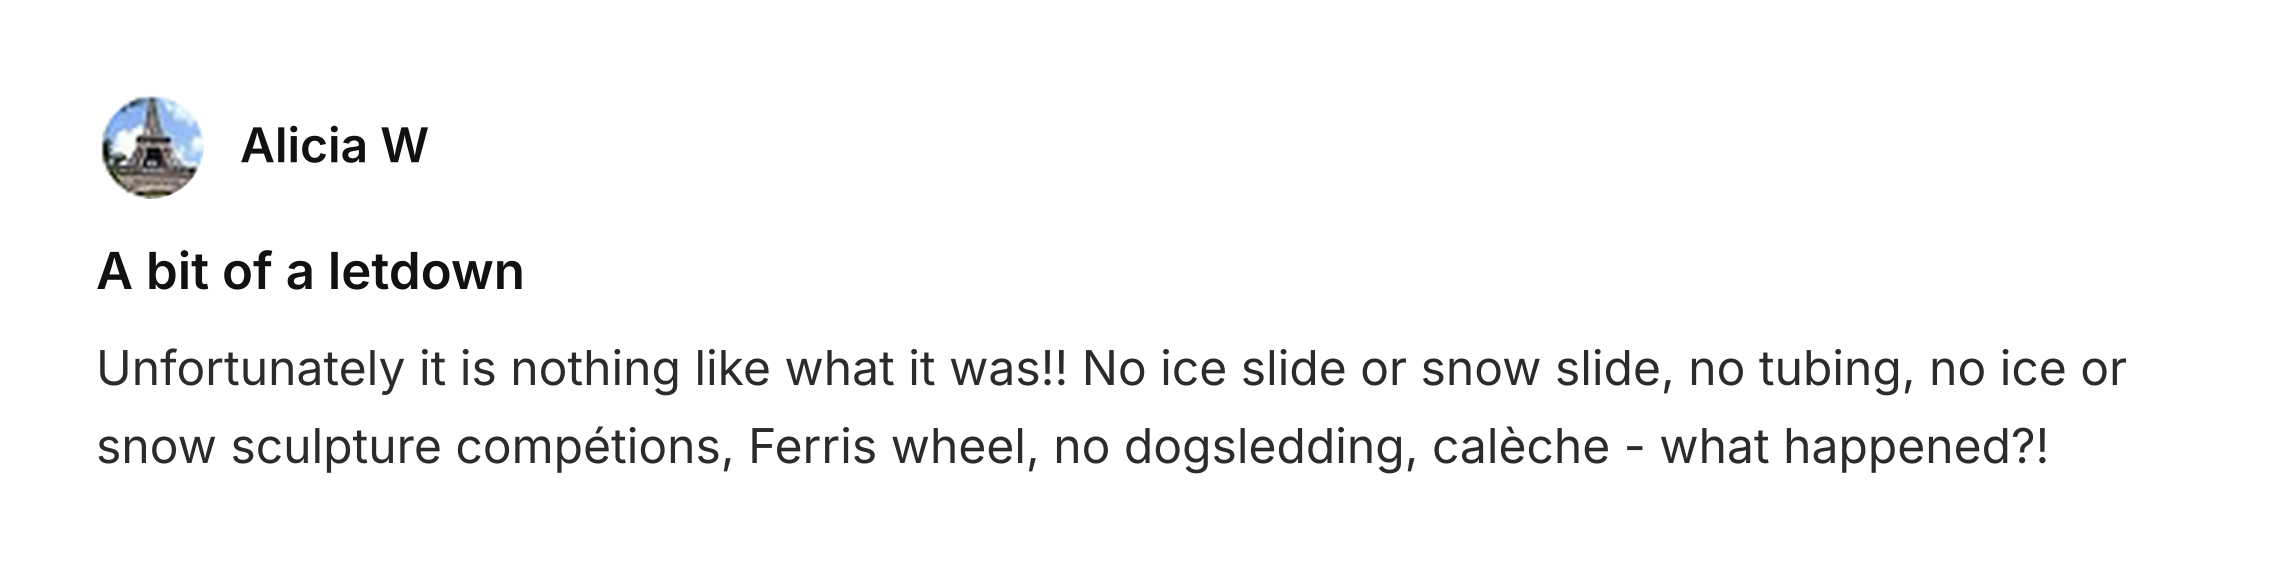
The official carnival map showed all the routes to each activity. However, it looked overcrowded, so it was hard for first-time visitors to know which activities to start with. This is because too many options can make it difficult for people to choose [1]. Therefore, we kept the main routes and only featured the activities that visitors enjoyed the most.
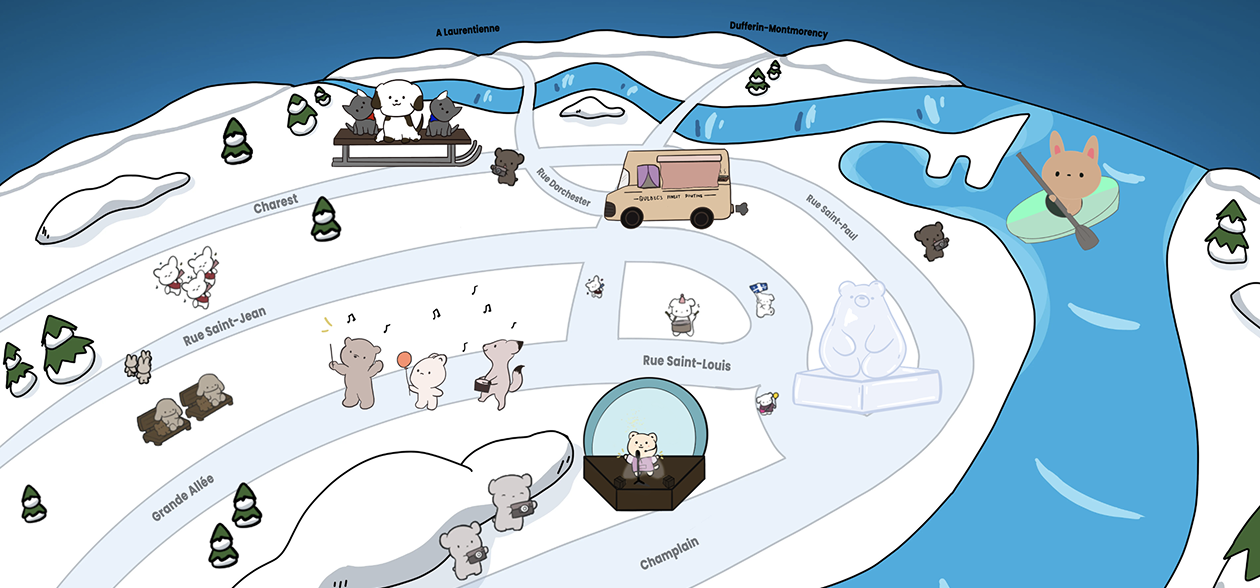
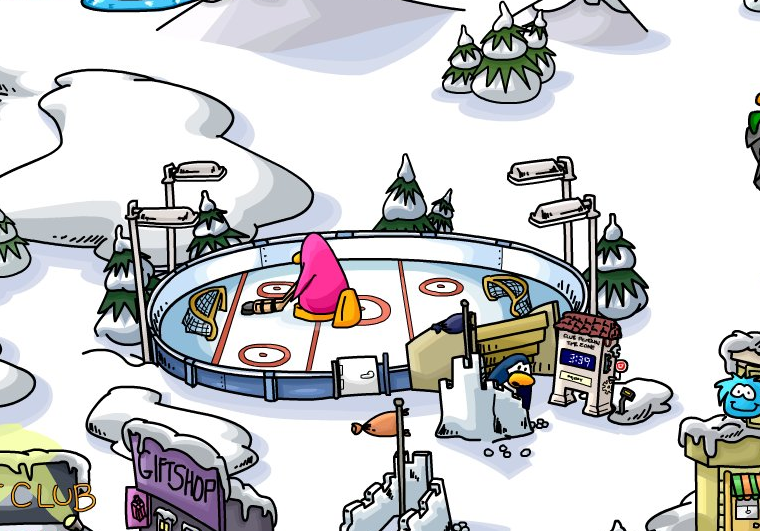
I was inspired by how the Club Penguin map shows each place as an illustration of what’s inside. Therefore, I used an illustration of each activity to mark where it is on our map. As a result, visitors can get a brief idea of what to expect when they see each illustration.
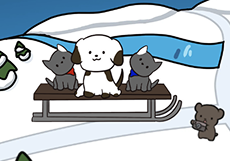
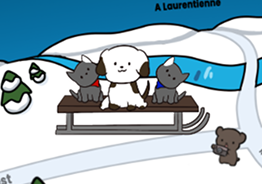
I used illustrations to give visitors an overview of the activities, with photos and descriptions in a pop-up when they want to learn more. This keeps the map simple while making the details easy to access [2]. Visitors can read about an activity, then return to the map to explore others.
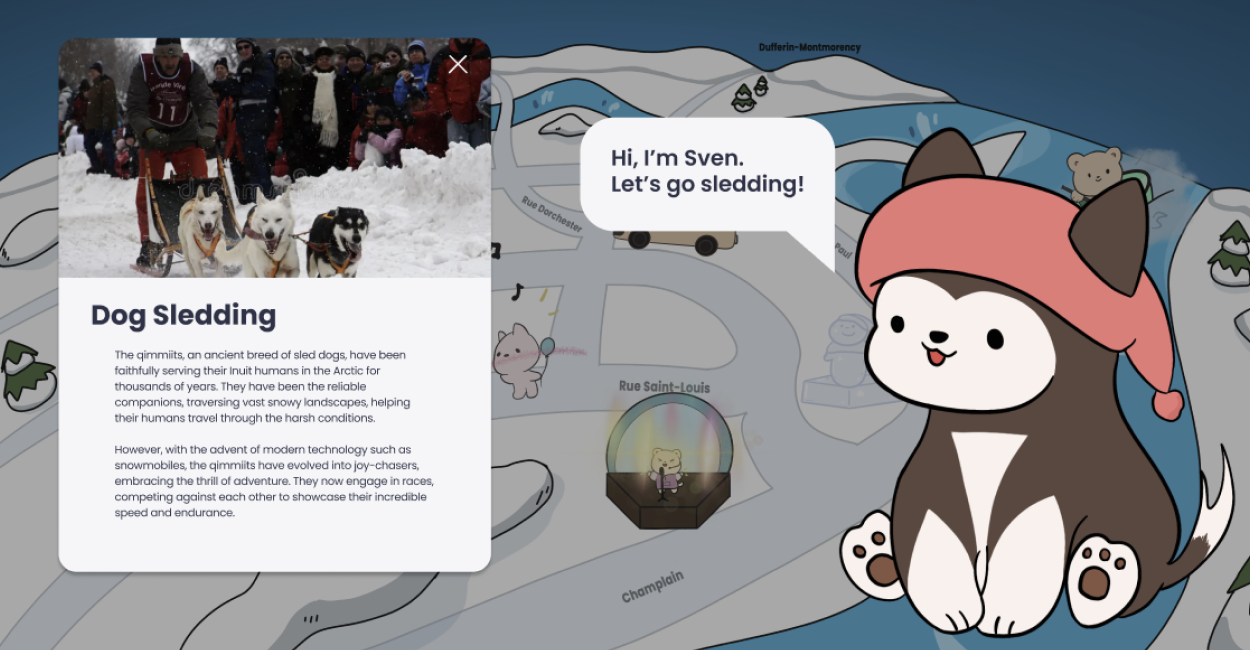
I asked my design instructor to review the activity pop-up and homepage. My goal was to see whether visitors could quickly understand each activity and decide if they wanted to try it.
The large mascot and its speech bubble distracted visitors from the activity’s photo and description. Therefore, I made the mascot smaller and removed its speech bubble, so visitors could quickly learn what each activity was about.
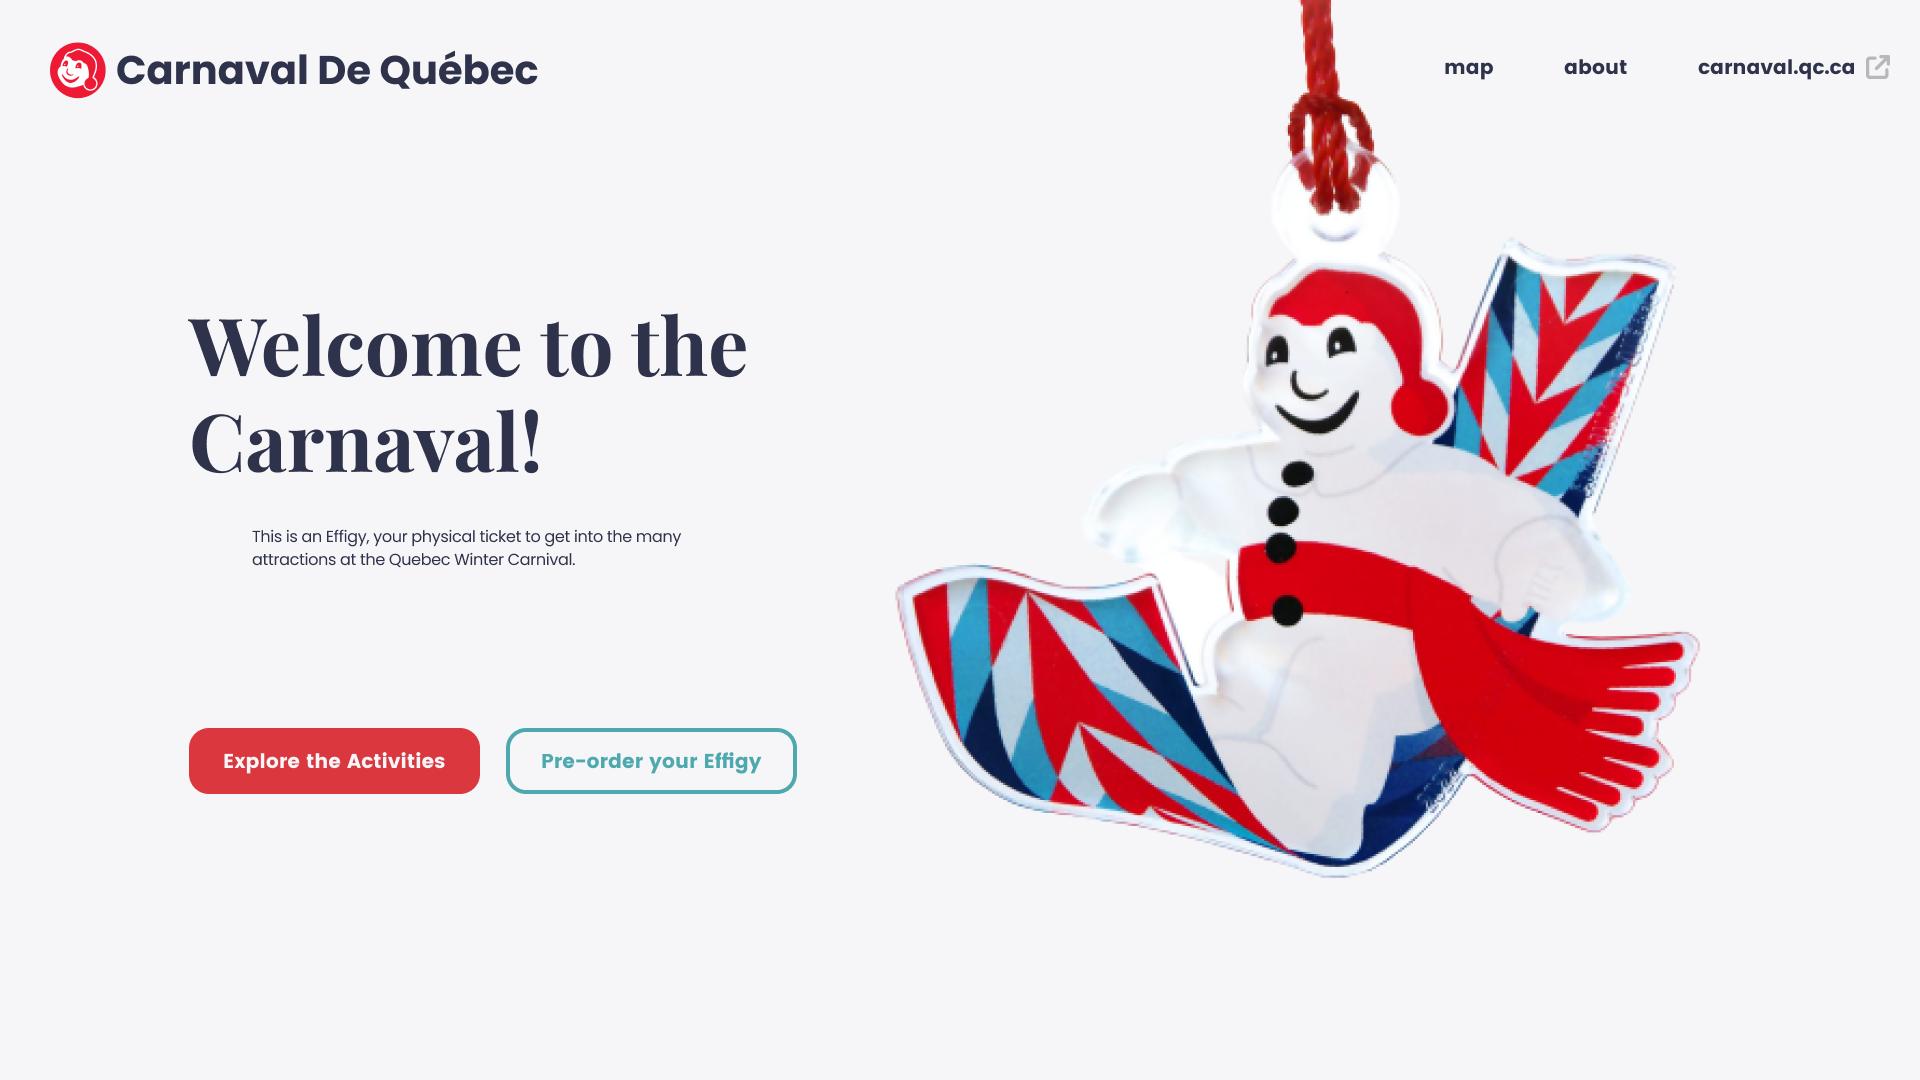
The snowman welcomed visitors but didn’t provide useful information. My instructor suggested giving the homepage image a clearer purpose, since people form their first impression of a website within a fraction of a second [3]. Therefore, I replaced the snowman with a snow globe that previews the map. As a result, visitors could see where to start as soon as they arrived.
Recognizing that some users use mobile phones rather than laptops to access the website, I implemented responsive web design principles. This included creating multiple breakpoints for various types of devices using CSS media queries and, in addition, using flexible images to automatically adjust their size to different screen sizes.
I coded the final design into a working microsite where visitors can explore the interactive map, discover carnival activities, learn about the effigy and the carnival, and visit the official website to buy tickets.
I learned that illustrations need to be large enough to recognize without distracting from the description. Finding that balance helps visitors understand the activity through both the image and the text.
Reading reviews helped me understand what visitors enjoyed and what they felt was missing. I learned to use their experiences to decide which activities to feature on the map.
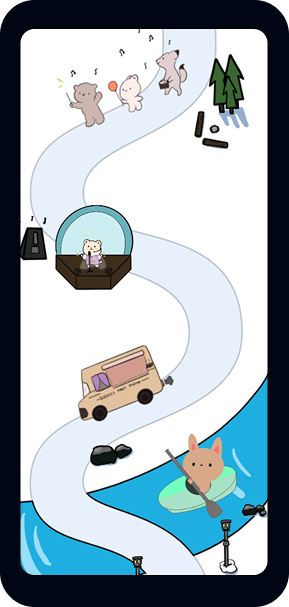
I learned that responsive design means adjusting the layout as well as its size. On phones, I arranged the activities along a winding path to give each illustration enough space to be seen and tapped.
I would ask first-time visitors to choose two activities on a phone and a laptop. This would show whether they get stuck or can’t decide from the descriptions, so I could fix those pain points.
Illustrations can be hard to recognize without labels. I would show visitors each one and ask what activity they think it is. If most of them guess wrong, I would add short labels underneath it.
I would add keyboard controls and screen reader labels for each activity, then check that the text meets WCAG contrast guidelines. I would also test whether visitors can explore the map using only a keyboard and a screen reader.
[1] Chernev, A., Böckenholt, U., & Goodman, J. (2015). Choice overload: A conceptual review and meta-analysis. Journal of Consumer Psychology, 25(2), 333–358. https://doi.org/10.1016/j.jcps.2014.08.002
[2] Nielsen, J. (2006). Progressive disclosure. Nielsen Norman Group. https://www.nngroup.com/articles/progressive-disclosure/
[3] Lindgaard, G., Fernandes, G., Dudek, C., & Brown, J. (2006). Attention web designers: You have 50 milliseconds to make a good first impression! Behaviour & Information Technology, 25(2), 115–126. https://doi.org/10.1080/01449290500330448
Follow the project from visitor reviews to a working microsite. Choose a stop to learn more.